Lifetime value
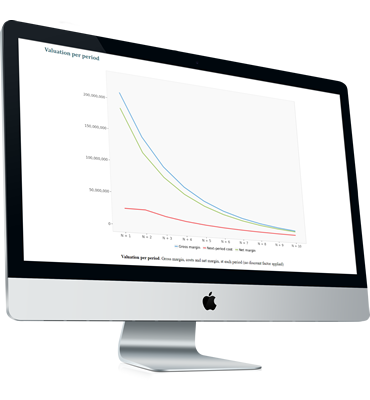
By measuring how customers move from one segment to another segment over time, this Enginius module helps predict the lifetime value of a customer based on which segment he or she belongs to today, as well as future sales, or the current value of the entire customer database as a whole.
What you put in...
- Observed churn rates
- Customer acquisition cost
- Number of customers/segments
- Gross margins by segment
- Customer transition probabilities across segments
What you get out...
- Value of current customer base
- Time required to recoup customer investments
- ROI on customer/segment investments
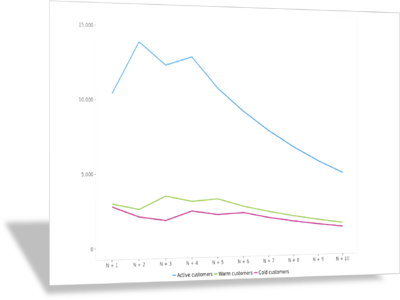
- Size and profitability of customer segments over time; sensitivity to marketing investment plan
Key features

Contractual or transactional
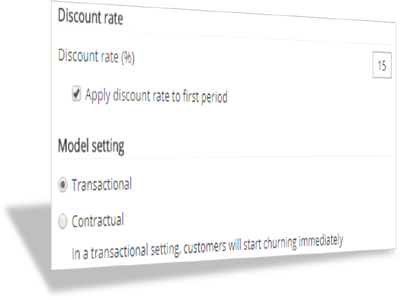
The lifetime value model can be calibrated with several options, such as the speed at which customers will churn (e.g., immediately -transactional- or at the end of contract period -contractual-). Discount rate can also be applied immediately or after one period.

Customer acquisition scenario
Customers churn over time, but they are also acquired and replaced. Enginius allows you to run multiple customer acquisition scenarios to simulate the impact of various acquisition strategies on the long-term value of a customer database.
About lifetime value
Customer Lifetime Value (CLV) is a metric of a customer’s value to the organization over the entire history of the relationship. Short-term sales are a factor, but so are overall customer satisfaction, the churn rate in the segment, and the costs to acquire a new customer and retain an existing customer.
The model uses the following input:
Segment Description
- Number of Customers per segment. As of today, how many customers does the company have in each segment?
- Gross Margins are the average margins that can be expected from a customer over each period (e.g., a year, a quarter), based on which segment this customer belongs to at the beginning of this period.
- Marketing Costs quantifies how much money the company spends per customer and per period, depending on which segment this customer belongs. Typically, active customers are followed more closely, receive more attention (e.g., direct marketing solicitations or sales representatives visits), and cost more to the firm.
Transition Matrix
- The Transition Matrix summarizes the likelihood a customer will switch segments at each period. This matrix should be read horizontally, and each line sums up to 100% (since all customers need to go somewhere). In the above example, an “active customer” has a 75% likelihood of still being in the same segment next period, and 25% chance of switching to the “warm customer” segment.


