Resource allocation
Enginius calibrates effort-to-impact response functions based on simple managerial estimates, and then helps optimize resource sizing and resource allocations across segments, products, advertising channels, etc., in order to maximize profit under various constraints.
What you put in...
- Number of market segments, products, geographies or other basis for resource allocation
- Current level of spending and associated sales
- Profit margins
- Response functions – how sales would change if spending were higher or lower than current spending
- Constraints (minimum / maximum) for each basis unit
What you get out...
- Optimal level of total spending
- Optimal allocation of spending across units
- Profit associated with optimal plan versus current plan
- Incremental gain or loss associated with changes from current or optimal plan
Key features
Powerful visualization
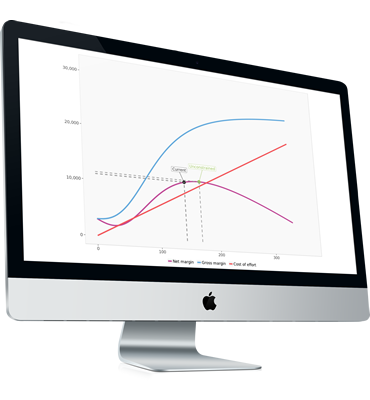
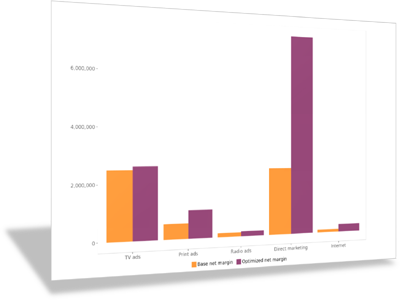
Enginius helps you easily visualize how efforts, impact, costs and profit evolve hand in hand, and where the optimal investment in allocation is. The charts also display the results of the current allocation, and the optimal solutions that can be achieved.
Optimization under constraint
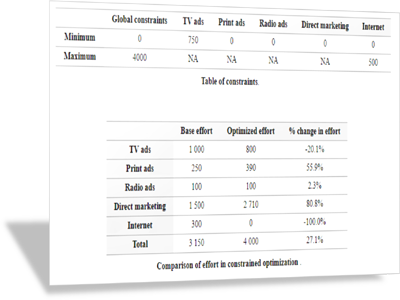
Cannot allocate more than a fixed amount? Need to spend at least some effort in a specific category even if such investment is financially suboptimal? No problem. You can easily setup both local and global, upper or lower constraints on your allocation efforts.
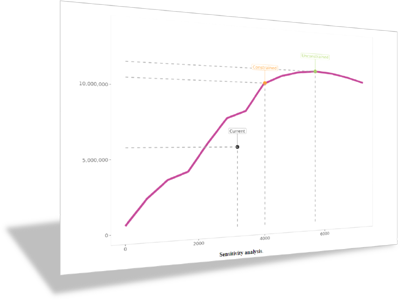
Sensitivity analysis
Sensitivity analysis is a powerful visualization tool that helps you determine the maximum results obtainable at various levels of investments. It is also useful to determine the extent of the “flat maximum” region, where additional investments bring about the same revenue as they cost.
About resource allocation
Resource Allocation helps optimize resource sizing and resource allocations across segments, products, channels, etc. It answers such questions as
- How much should we spend in total during a given planning horizon?
- How should that spending get allocated to each product or market segment? To each marketing mix element? How much of our budget should be spent on advertising and other forms of impersonal marketing communications? On sales promotions? On the sales force?
- How should budgets given to an individual (e.g., salesperson, manager of department) be allocated? To customers? To geographies? To sub-elements of the marketing communications mix? Over time?
There are four primary steps:
- Enter data for current efforts and outcomes– typically these are hard data about current market situations.
- Enter calibration data–typically these are judgmental data, unless there are data available from experimentation.
- Calibrate the response curves. Check to ensure that the curves fit the points.
- Run the analysis (and optionally enter constraints).


